View Tab

- Double click the view tab to maximize the view full screen. Double click it again to restore.
- Right mouse click on the view tab to open the view popup menu.
- Click

- in the view tab to close the Symbol Stats History view.
- Left mouse click the view tab and hold down the mouse button to move the Symbol Stats History view. Release the mouse button to place it.
View Toolbar
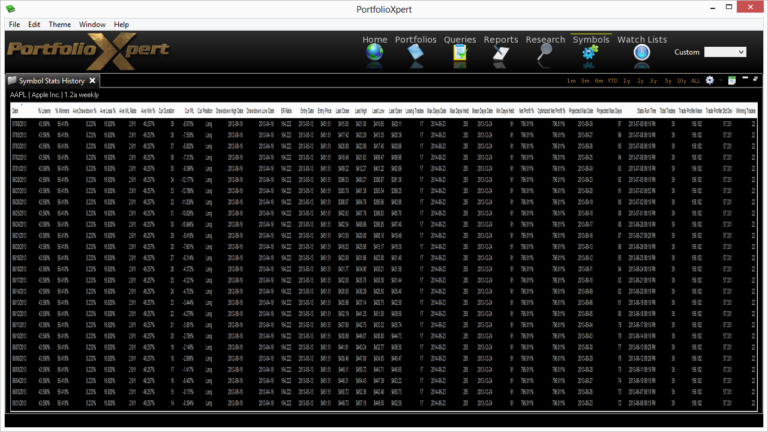
The View Toolbar contains controls and settings specific to the Symbol Stats History view.
Time Interval buttons
- Click a time interval button

- to select the time frame displayed in the table.
General Settings button
- Click

- to select the time frame displayed in the table (contains additional time frames not present as time interval buttons, such as 9 Months and Custom).
Table to Spreadsheet button
- Click

- to export the Symbol Stats History table to a spreadsheet (sorting applied prior to exporting will be preserved in the spreadsheet).
Information Displayed
- Date – date of historical stat values
- % Losers – percentage of losing trades for a security using the indicated trading system/model as compared to the Total Trades
- % Winners – percentage of winning trades for a security using the indicated trading system/model as compared to the Total Trades
- Ave Drawdown % – average percentage decline for all trades in a security from each trade’s peak level to each trade’s low using the indicated trading system/model
- Ave Loss % – average percentage loss on all losing trades for a security using the indicated trading system/model
- Ave WL Ratio – amount of gains made for every dollar lost for a security using the indicated trading system/model (calculated by dividing the Ave Win % by the Ave Loss %)
- Ave Win % – average percentage gain on all winning trades for a security using the indicated trading system/model
- Cur Duration – number of days a security has been held in the current trade using the indicated trading system/model
- Cur P/L – percentage profit or loss experienced by a security in the current trade using the indicated trading system/model
- Cur Position – current position of security using the indicated trading system/model (e.g. Long, Flat, Buy Order, Sell Order)
- Drawdown High Date – date the current or most recent trade in a security hit a high point using the indicated trading system/model
- Drawdown Low Date – date the current or most recent trade in a security hit a low point using the indicated trading system/model
- ER Ratio – illustrates how well a security has traded historically using the indicated trading system/model (calculated by multiplying % Winners by Ave WL Ratio)
- Entry Date – date the indicated trading system/model purchased the security for the current trade
- Entry Price – assumed price the indicated trading system/model purchased the security for the current trade
- Last Close – closing price on date indicated
- Last High – highest intra-day price on date indicated
- Last Low – lowest intra-day price on date indicated
- Last Open – opening price on date indicated
- Losing Trades – number of trades, as defined by a buy and subsequent sell, that resulted in negative returns for a security using the indicated trading system/model
- Max Days Date – date when the current trade is likely to meet the Max Days Held value (estimated using the maximum holding period for any trade in a security throughout its history)
- Max Days Held – maximum number of days a security has been held using the indicated trading system/model throughout its history
- Mean Days Date – date when the current trade is likely to meet the Trade Profile Mean value (estimated using the average holding period for all trades in a security throughout its history)
- Min Days Held – minimum number of days a security has been held using the indicated trading system/model throughout its history
- Net Profit % – cumulative percentage gain for all trades, as defined by a buy and subsequent sell, in a security using the indicated trading system/model
- Optimized Net Profit % – cumulative percentage net gain for all trades, as defined by a buy and subsequent sell, in a security using the indicated trading system/model (looks at the model with the largest Net Profit % over the last 6 month period from Jan 1 – Jun 30 or Jul 1 – Dec 31)
- Projected Max Date – date when the current trade is likely to meet the Projected Max Days value (estimated by adding the Current Duration value to the Trade Profile Std Dev value)
- Projected Max Days – calculated by adding the Current Duration value to the Trade Profile Std Dev value
- Stats Run Time – date corresponding to the last time the statistics were updated for a security using the indicated trading system/model
- Total Trades – number of trades, as defined by a buy and subsequent sell, for a security using the indicated trading system/model
- Trade Profile Mean – average or expected number of days a security is expected to be held using the indicated trading system/model (estimated using the average holding period for all trades in a security throughout its history)
- Trade Profile Std Dev – standard deviation of the number of days a security is held on average using the indicated trading system/model (estimated using the average holding period for all trades in a security throughout its history)
- Winning Trades – number of trades, as defined by a buy and subsequent sell, that resulted in positive returns for a security using the indicated trading system/model