View Tab

- Double click the view tab to maximize the view full screen. Double click it again to restore.
- Right mouse click on the view tab to open the view popup menu.
- Click

- in the view tab to close the Research view.
- Left mouse click the view tab and hold down the mouse button to move the Research view. Release the mouse button to place it.
Research Modes
The Research view contains two research modes:
- Click Daily Research (screenshot) to have all the information in the Research view be based on the optimized daily model (1.2a Daily or 3.2a Daily).
- Click Weekly Research (screenshot) to have all the information in the Research view be based on the optimized weekly model (1.2a Weekly or 3.2a Weekly).
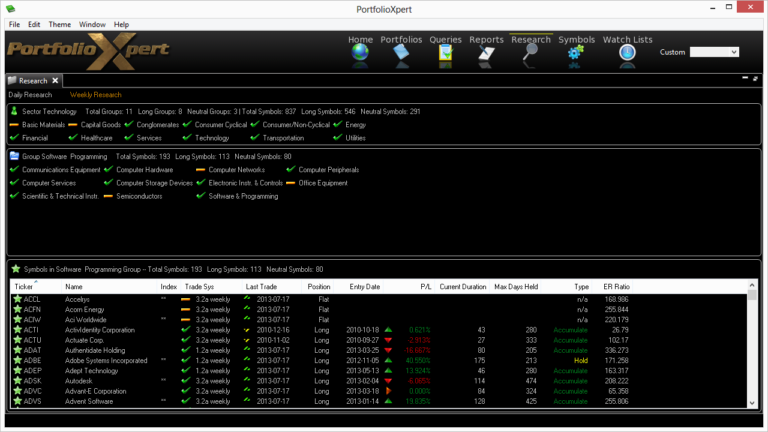
Sectors Pane
The Sectors Pane:
- Lists each Sector within the VPM Universe and displays the current position of each where

- indicates Long,

- indicates Buy,

- indicates Flat, and

- indicates Sell (screenshot).
- Summarizes the total number of Industry Groups and Symbols within a selected Sector, breaking down how many are Long versus how many are Flat (Neutral) positions (screenshot).
Groups Pane
The Groups Pane:
- Lists each Industry Group within a Sector selected from the Sectors Pane and displays the current position of each where

- indicates Long,

- indicates Buy,

- indicates Flat, and

- indicates Sell (screenshot).
- Summarizes the total number of Symbols within a selected Industry Group, breaking down how many are Long versus how many are Flat (Neutral) positions (screenshot).
Information Pane
The items listed in the Information Pane vary depending on what is selected, such that:
- Clicking

- from the Sectors Pane will list all of the Sectors within the VPM Universe.
- Clicking a Sector from the Sectors Pane will list all of the Industry Groups within that particular Sector and will also summarize the total number of Symbols within the selected sector, breaking down how many are Long versus how many are Flat (Neutral) positions.
- Clicking

- from the Groups Pane will list all of the Industry Groups within the VPM Universe.
- Clicking an Industry Group from the Groups Pane will list all of the Symbols within that particular Industry Group and will also summarize the total number of Symbols within the selected group, breaking down how many are Long versus how many are Flat (Neutral) positions.
The following information is displayed for any item listed:
- Ticker – sector, group, or security ticker symbol
- Name – sector, group, or security name
- Index – indicates whether or not the security is part of the group index (** indicates it is)
- Trade Sys – optimized trading system/model being utilized (depends on Research Mode selected)
- Last Trade – date of the last available closing price
- Position – current position of security using the indicated trading system/model (e.g. Long, Buy Order, Flat, Sell Order)
- Entry Date – date the indicated trading system/model purchased the security for the current trade
- P/L – percentage profit or loss experienced by the security in the current trade using the indicated trading system/model
- Current Duration – number of days a security has been held in the current trade using the indicated trading system/model
- Max Days Held – maximum number of days a security has been held using the indicated trading system/model throughout its history
- Type – current trading system/model’s recommendation for the security based on the Current Duration of the trade in relation to the Trade Profile Mean (e.g. New Position, Accumulate, Hold, Underperform)
- ER Ratio – illustrates how well the security has traded historically using the indicated trading system/model (calculated by multiplying % Winners by Ave WL Ratio)