View Tab

- Double click the view tab to maximize the view full screen. Double click it again to restore.
- Right mouse click on the view tab to open the view popup menu.
- Click

- in the view tab to close the Active Symbols view.
- Left mouse click the view tab and hold down the mouse button to move the Active Symbols view. Release the mouse button to place it.
View Toolbar
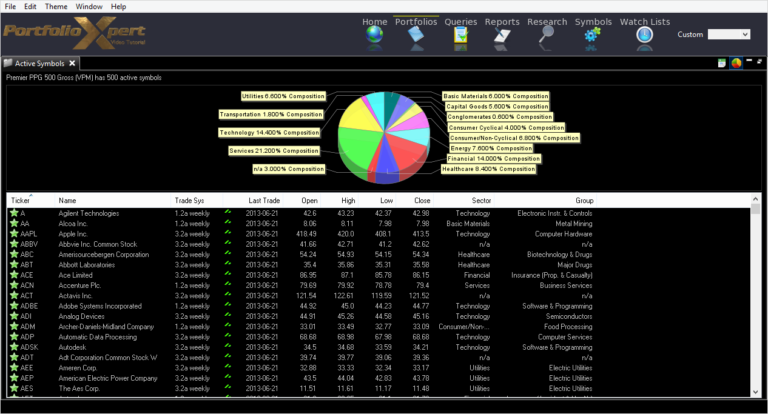
The View Toolbar contains controls and settings specific to the Active Symbols view. Mouse hover over a button to see its tooltip.
Table to Spreadsheet button
- Click

- to export the Active Symbols table to a spreadsheet (sorting applied prior to exporting will be preserved in the spreadsheet).
Show Chart button
- Click

- to toggle the Active Symbols composition chart on and off.
Information Displayed
- Ticker – security ticker symbol
- Name – security name
- Trade System – trading system/model being utilized (e.g. 1.2a daily, 1.2a weekly, 3.2a daily, 3.2a weekly)
- Last Trade – date of the last available closing price
- Open – open price on date listed in the Last Trade column
- High – highest intra-day price on date listed in the Last Trade column
- Low – lowest intra-day price on date listed in the Last Trade column
- Close – closing price on date listed in the Last Trade column
- Sector – business or economic segment classification (if applicable)
- Group – industry classification (if applicable)