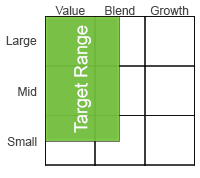
Growth Stock Screens
 The Accelerating U.S. Growth screen broadly looks for U.S.-based growth companies across all market capitalizations. The screen is designed to identify companies that have been experiencing accelerating earnings growth along with relatively stable and improving returns.
It places a strong emphasis on a company’s earnings growth and returns on invested capital. Companies that pass the screen’s criteria are ranked by an aggregated score that considers quality-, growth- and value-related metrics, such as profitability, earnings momentum, returns on the business, price-to-book and debt management.
The weekly 1.2 and 3.2 trading systems for each stock are then assigned a WaveTech timeliness rating based on their respective trading statistics through the first Monday following the screen date.
The High Growth High Return screen broadly looks for U.S.-based growth companies across all market capitalizations that are generating relatively high returns and recent earnings momentum. The screen is designed to identify companies that have been experiencing improving sales and earnings growth relative to recent history. It places a strong emphasis on a company’s various return metrics (i.e. return on invested capital, return on equity, etc.) and valuation ratios (i.e. earnings yield, price-to-book, etc.). Companies that pass the screen’s criteria are ranked by an aggregated fundamental score that looks at growth, returns, risk and valuations, with a greater emphasis on valuation.
The weekly 1.2 and 3.2 trading systems for each stock are then assigned a WaveTech timeliness rating based on their respective trading statistics through the first Monday following the screen date.
The U.S. GARP screen broadly seeks U.S.-based growth companies across all market capitalizations that are reasonably priced. The screen is designed to identify companies that have been experiencing relatively solid sales and earnings growth.It places a strong emphasis on a company’s recent earnings growth, forecasted earnings, valuation and returns generated by the business. Companies that pass the screen’s criteria are ranked by a number of valuation metrics, which include forward and current price-to- earnings, price-to-free cash flow and price-to-book values, to name a few.
The weekly 1.2 and 3.2 trading systems for each stock are then assigned a WaveTech timeliness rating based on their respective trading statistics through the first Monday following the screen date.
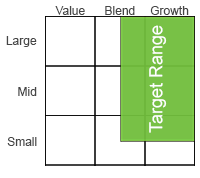
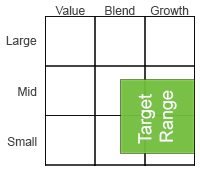 The U.S. SMID-cap growth screen, formerly the High Beta U.S. Small-cap Growth, looks for relatively small-to-medium sized U.S.-based companies that may be poised for continued strong growth. The screen is designed to identify reasonably priced stocks of companies that have been experiencing accelerating growth and relatively high returns within their industries.
The results tend to reflect a basket of stocks that have relatively high volatility, making this one of the more aggressive strategies to pursue. Companies that pass the screen’s criteria are ranked by a quality score that looks at operating margins, asset efficiency, returns on the business and debt management.
The weekly 1.2 and 3.2 trading systems for each stock are then assigned a WaveTech timeliness rating based on their respective trading statistics through the first Monday following the screen date.
Blended Stock Screens
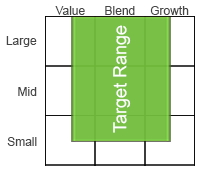 The Low Beta High Return screen broadly looks for larger U.S.-based companies with lower relative volatility or beta. While the term “Low Beta” is not used to imply low risk, the results tend to include a number of stocks with lower overall volatility. The screen is designed to identify companies that have been experiencing improving sales and earnings growth relative to recent history.
It places a strong emphasis on a company’s various return metrics (i.e. return on invested capital, return on equity, etc.) and valuation ratios (i.e. earnings yield, price-to-book, etc.). Companies that pass the screen’s criteria are ranked by a quality score that looks at operating margins, asset efficiency, returns on the business and debt management.
The weekly 1.2 and 3.2 trading systems for each stock are then assigned a WaveTech timeliness rating based on their respective trading statistics through the first Monday following the screen date.
 The High Return U.S. Dividend Payers screen broadly seeks U.S.-based dividend paying companies across all market capitalizations. The screen is designed to identify companies with improving sales and earnings growth relative to recent history. It also seeks companies that have been paying a dividend that may be less likely to be reduced and more likely to be increased.
There is a strong emphasis on a company’s various return metrics (i.e. return on invested capital, return on equity, etc.) and valuation ratios (i.e. earnings yield, price-to-book, etc.) within this screen. Companies that pass the screen’s criteria are ranked by an aggregated fundamental score that looks at growth, returns, risk and valuations, with a greater emphasis on valuation.
The weekly 1.2 and 3.2 trading systems for each stock are then assigned a WaveTech timeliness rating based on their respective trading statistics through the first Monday following the screen date.
Value Stock Screens
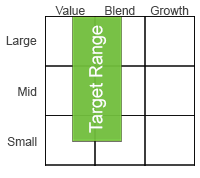
 The Common Sense Value screen broadly seeks healthy U.S. companies across all market capitalizations with low price-to-book values. The screen attempts to replicate the common sense value-driven approach demonstrated by Professor Joseph Piotroski in “Value Investing: The Use of Historical Financial Statement Information to Separate Winners from Losers.” The main goal is to avoid the “value-trap” by not investing in companies that are trading inexpensively because of poor financial health or poor future prospects.
The screen’s main focus is on price-to-book value and balance sheet strength, which is driven by improving profitability, return on assets and debt and liquidity trends. Companies that pass the screen’s criteria are ranked by their price-to-book value and a composite designed to identify fundamental strength.
The weekly 1.2 and 3.2 trading systems for each stock are then assigned a WaveTech timeliness rating based on their respective trading statistics through the first Monday following the screen date.
The Magic Formula Value screen broadly seeks quality U.S.-based companies across all market capitalizations that are reasonably priced. This somewhat conservative screen attempts to replicate the “magic formula” espoused by Joel Greenblatt in “The Little Book that beats the Market.” Its main focus is on a company’s return on invested capital (ROIC) and earnings yield. The ROIC metric simply looks at the operating income after depreciation relative to the key tangible assets of a firm (i.e. plant & equipment, inventory and accounts receivables). The earnings yield is based on operating income after depreciation and enterprise value of a company. Enterprise value is defined as the total equity and debt of the firm less its cash.Given the definition of enterprise value and ROIC, this screen eliminates financials, utilities and real estate operating companies in favor of firms with more traditional balance sheets. Companies that pass the screen’s criteria are ranked by their earnings yield and ROIC equally.
The weekly 1.2 and 3.2 trading systems for each stock are then assigned a WaveTech timeliness rating based on their respective trading statistics through the first Monday following the screen date.
The Old School Value screen broadly seeks dividend paying U.S. companies across all market capitalizations with improving earnings momentum and balance sheets that are not overly leveraged. The screen attempts to replicate the approach espoused by Ben Graham, one of the fathers of fundamental analysis. Balance sheet strength, dividend payments and positive earnings are key elements of this approach.The idea is that companies that manage their debt levels well and have positive earnings are less likely to run into financial stress and may be more likely to increase their dividend payments. Companies that pass the screen’s criteria are ranked on a composite of value metrics (i.e. price-to-earnings ratio and price-to-book), earnings growth and earnings stability.
The weekly 1.2 and 3.2 trading systems for each stock are then assigned a WaveTech timeliness rating based on their respective trading statistics through the first Monday following the screen date.
The U.S. Multi-cap Value screen broadly seeks U.S.-based companies across all market capitalizations that may be undervalued and have reasonably healthy balance sheets. The screen is designed to identify companies that have been experiencing positive and stable returns with recent growth less of a consideration.
It places a strong emphasis on a company’s absolute and relative valuation using metrics like price-to-free cash flow and price-to-book value. Companies that pass the screen’s criteria are ranked by an aggregated fundamental score that looks at growth, returns, risk and valuations, with a greater emphasis on growth and returns.
The weekly 1.2 and 3.2 trading systems for each stock are then assigned a WaveTech timeliness rating based on their respective trading statistics through the first Monday following the screen date. |
Idea |
Detail |
How |
Where |
|
Build Multi-Cap Single Style Model Portfolio |
|
|
Current Combined tab |
|
Build Single Style Model Portfolio |
|
|
Current Combined tab |
|
Build Multi-Cap Blended Model Portfolio |
|
|
Current Matrix tab |
|
Build Blended Model Portfolio |
|
|
Current Matrix tab |
|
Supplement Existing Model Portfolios / Watch Lists |
|
|
Current Combined or Current Matrix tabs |
General Philosophy
Idea generation starts with narrowing the investable universe down to a manageable list. We start with a fundamental screen of quality companies to work with the best. Next, we apply WaveTech’s trend following statistical modeling process.
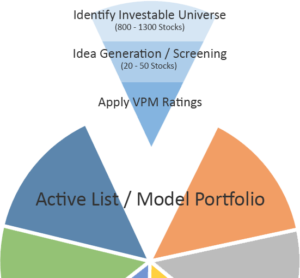
What is the Investable Universe?
We start with basic criteria that lends itself to active management.
- Market capitalization > $250 million
- Recent and average stock price > $5/share
- 1-year average daily trading volume ≥ 500,000 shares
- No American Depository Receipts (ADRs)
Idea Generation – The Fundamental Screen
- Reduce the investable universe to a more manageable list of 20 – 50 quality stock ideas1based on specific criteria that fits a particular investment style or objective
- Classify key variables into four fundamental categories
|
Relative Valuation |
Earnings Quality |
|
Financial Strength |
Momentum |
- Rank fundamental data and weight each variable and category to reflect the targeted investment style or objective
Duration Rankings
WaveTech’s rating system is based on the prior lengths of time invested, or Trade Duration.
This rating identifies how far the stock is into the average trade duration to find opportunities to outperform.
Duration in Days
Hypothetical Model Statistics
Ave. Long (days) 100
Ave. Long SD* (days) 50
*Standard Deviation
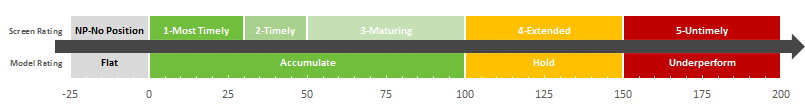
WaveTech RATINGS
| WaveTech Rating | Description |
| NP | The indicated WaveTech model does not currently recommend a position in the stock. |
| 1 – Most Timely | The WaveTech model recommends a position in the stock or has an Accumulate status and the duration of the current recommendation is less than 30% of its average holding period. The recommended position is in its early stages and has the most appealing risk/reward potential from the WaveTech model’s perspective. |
| 2 – Timely | The indicated WaveTech model maintains its Accumulate recommendation, but the current position duration is between 30% and 50% of its average holding period. The recommended position is still relatively early and continues to have an attractive risk/reward profile within the WaveTech’s model. |
| 3 – Maturing | The indicated WaveTech model’s recommendation is a Hold and the current position duration is between 50% and 100% of the average holding period. The risk/reward is less appealing, but initiating a position may still be warranted. |
| 4 – Extended | The indicated WaveTech model maintains a Hold recommendation and the current position duration is beyond the average holding period for the model, yet still within one standard deviation of its average holding period. The risk/reward profile of the position is unattractive or becoming ‘long in the tooth.’ Initiating a position at this stage may pose greater risk than ideal. |
| 5 – Untimely | The indicated WaveTech model has an Underperform recommendation on the stock with the current position duration beyond one standard deviation of its average holding period. From the model’s perspective, the risk/reward profile is unfavorable and entering a position in the stock may be unwarranted. |
Fundamental Data
| Ranking/Scoring | Description |
| Fundamental Quality | Attempts to highlight companies with healthier income streams, profitability and returns as well as greater asset efficiency and healthier balance sheets. |
| Aggregate Quality, Value, Growth | Attempts to score a company across 3 main areas (quality, valuation and growth). It looks at a number of earnings- and sales-related items, including recent growth and forecasted growth. It also considers a number of valuation metrics (i.e. price-to-book, price-to-earnings, etc.) and quality items (i.e. leverage, liquidity, profit margins). |
| Aggregate Fundamentals | Attempts to score a company across 4 main areas (valuation, returns, growth and risk). It places a heavier weight on a number of valuation metrics (i.e. price-to-book, price-to-earnings, etc.) and return measures, such as return on invested capital (ROIC). It also considers a number of earnings- and sales-related items, including recent growth and forecasted growth, and risk metrics, such as volatility and balance sheet strength. |
| Fundamental Value | Looks at a number of earnings-driven and balance sheet-driven valuation metrics to formulate a composite score for the company. |
| Aggregate Fundamentals – Growth Tilt | Attempts to score a company across 4 main areas (returns, growth, valuation, and risk). It places a heavier weight on a number of return and growth metrics, such as recent and forecasted sales and earnings growth and return on invested capital (ROIC). It also considers a number of valuation measures (i.e. price-to-book, price-to-earnings, etc.) and risk metrics, such as volatility and balance sheet strength. |
| Return Quality | Attempts to highlight companies with strong earnings yield or operating earnings and high returns on invested capital (ROIC). |
| Book Value/Balance sheet Strength | Takes a balance sheet approach to valuation through focusing primarily on price-to-book values. It attempts to highlight those companies that are attractively valued and have improving profitability, operating cash flows and overall balance sheet health. |
| Quality Value | Attempts to highlight companies with greater earnings growth and earnings stability relative to a composite score of several valuation metrics (i.e. price-to-earnings ratio and price-to-book). |