View Tab

- Double click the view tab to maximize the view full screen. Double click it again to restore.
- Right mouse click on the view tab to open the view popup menu.
- Click

- in the view tab to close the Portfolio Symbol Returns view.
- Left mouse click the view tab and hold down the mouse button to move the Portfolio Symbol Returns view. Release the mouse button to place it.
View Toolbar
The View Toolbar contains controls and settings specific to the Portfolio Symbol Returns view. Mouse hover over a button to see its tooltip.
Table to Spreadsheet button
- Click

- to export the Portfolio Symbol Returns table to a spreadsheet (sorting applied prior to exporting will be preserved in the spreadsheet).
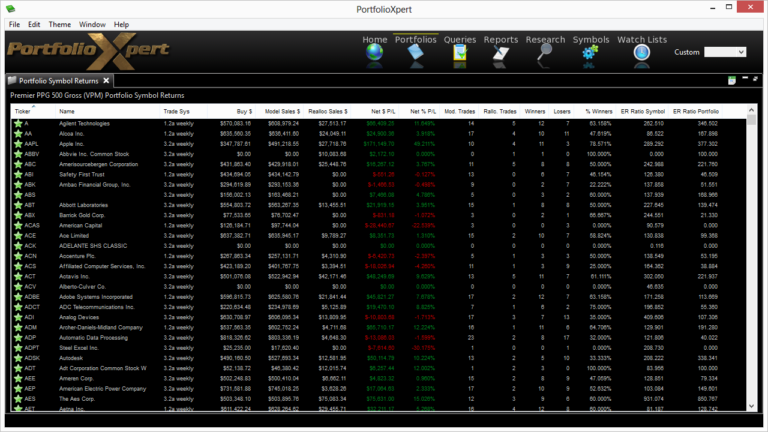
Information Displayed
- Ticker – security ticker symbol
- Name – security name
- Trade System – trading system/model being utilized (e.g. 1.2a daily, 1.2a weekly, 3.2a daily, 3.2a weekly)
- Buy $ – total dollars spent on purchases
- Model Sales $ – total dollars gained in model sells
- Realloc Sales $ – total dollars gained in reallocation sells
- Net $ P/L – dollar net gain or loss from cumulative transactions (calculated by adding Model Sales $ to Realloc Sales $ and subtracting Buy $ from the total)
- Net % P/L – percent net gain or loss from cumulative transactions (calculated by dividing Net $ P/L by Buy $)
- Mod. Trades – number of model trades, as defined by a buy and subsequent sell, using the indicated trading system/model
- Rallc. Trades – number of reallocation trades using the indicated trading system/model
- Winners – number of trades, as defined by a buy and subsequent sell, that resulted in positive returns using the indicated trading system/model
- Losers – number of trades, as defined by a buy and subsequent sell, that resulted in negative returns using the indicated trading system/model
- % Winners – percentage of winning trades using the indicated trading system/model as compared to the Total Trades (Mod. Trades + Rallc. Trades)
- ER Ratio Symbol – illustrates how well the security has traded historically using the indicated trading system/model (calculated by multiplying % Winners by Average WL Ratio)
- ER Ratio Portfolio – illustrates how well the security has traded since the portfolio inception date using the indicated trading system/model