View Tab

- Double click the view tab to maximize the view full screen. Double click it again to restore.
- Right mouse click on the view tab to open the view popup menu.
- Click

- in the view tab to close the Open Positions view.
- Left mouse click the view tab and hold down the mouse button to move the Open Positions view. Release the mouse button to place it.
View Toolbar
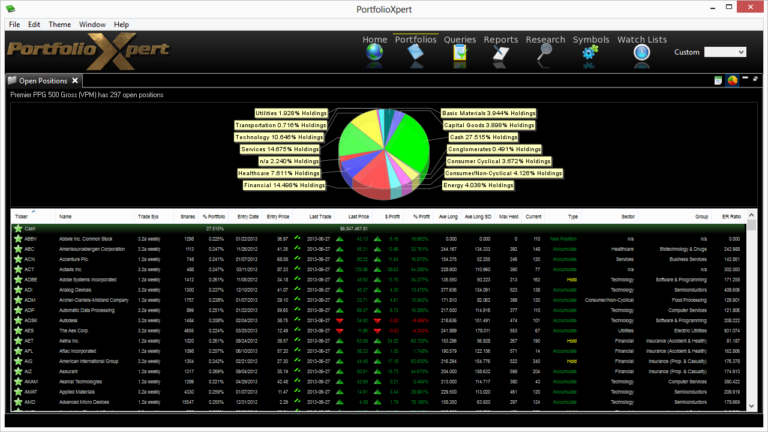
The View Toolbar contains controls and settings specific to the Open Positions view. Mouse hover over a button to see its tooltip.
Table to Spreadsheet button
- Click

- to export the Open Positions table to a spreadsheet (sorting applied prior to exporting will be preserved in the spreadsheet).
Show Chart button
- Click

- to toggle the Open Positions holdings chart on and off.
Information Displayed
- Ticker – security ticker symbol
- Name – security name
- Trade System – trading system/model being utilized (e.g. 1.2a daily, 1.2a weekly, 3.2a daily, 3.2a weekly)
- Shares – number of shares currently held
- % Portfolio – current allocation of the security in the portfolio
- Entry Date – date the indicated trading system/model purchased the security for the current trade
- Entry Price – assumed price the indicated trading system/model purchased the security for the current trade
- Last Trade – date of the last available closing price
- Last Price – last closing price
- $ Profit – dollar change from the Entry Price to the Last Price
- % Profit – percent change from the Entry Price to the Last Price
- Ave Long – average or expected number of days the security is expected to be held using the indicated trading system/model
- Ave Long SD – standard deviation of the number of days the security is held on average using the indicated trading system/model
- Max Held – maximum number of days the security has been held using the indicated trading system/model throughout its history
- Current – number of days the security has been held in the current trade using the indicated trading system/model
- Type – current trading system/model’s recommendation for the security based on the Current Duration of the trade in relation to the Trade Profile Mean (e.g. New Position, Accumulate, Hold, Underperform)
- Sector – security’s business or economic segment classification (if applicable)
- Group – security’s industry classification (if applicable)
- ER Ratio – illustrates how well the security has traded historically using the indicated trading system/model (calculated by multiplying % Winners by Average WL Ratio)