View Tab

- Double click the view tab to maximize the view full screen. Double click it again to restore.
- Right mouse click on the view tab to open the view popup menu.
- Click

- in the view tab to close the Long Positions Breakdown Chart view.
- Left mouse click the view tab and hold down the mouse button to move the Long Positions Breakdown Chart view. Release the mouse button to place it.
View Toolbar
The View Toolbar contains controls and settings specific to the Long Positions Breakdown Chart view.
General Settings button
- Click

- to select whether or not to Animate the pie chart, Show Labels, or Show Legend (screenshot).
Using With the Research View
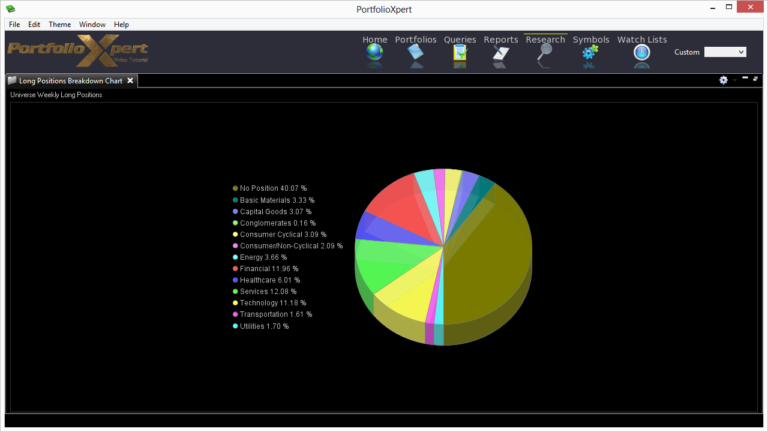
The Long Positions Breakdown Chart is primarily used in conjunction with the Research view such that:
- Clicking

- from the Sectors Pane of the Research view will display the number of securities within each Sector that the indicated trading system/model holds compared to the total number of securities within the VPM Universe assigned to a Sector.
- For example, as of 07/17/2013 and based on the weekly models (1.2a Weekly and 3.2a Weekly) the VPM Universe is flat 40.07% of the total number of securities in the database assigned to a Sector (screenshot).
- Clicking a Sector from the Sectors Pane of the Research view will display the number of securities within each assigned Industry Group that the indicated trading system/model holds compared to the total number of securities assigned to the selected Sector.
- For example, as of 07/17/2013 and based on the weekly models (1.2a Weekly and 3.2a Weekly) the Technology Sector is flat 34.73% of the total number of securities assigned to it (screenshot).
- Clicking an Industry Group from the Groups Pane of the Research view will display the number of securities within the group that the indicated trading system/model holds compared to the total number of the securities assigned to the selected Industry Group.
- For example, as of 07/17/2013 and based on the weekly models (1.2a Weekly and 3.2a Weekly) the Computer Hardware Group is flat 35.00% of the total number of securities assigned to it (screenshot).
- Clicking an individual security from either the Information Pane of the Research view or from any other view in PortfolioXpert acts the same as selecting the Sector it is assigned to (if applicable). Refer to #2 above for details.