View Tab

- Double click the view tab to maximize the view full screen. Double click it again to restore.
- Right mouse click on the view tab to open the view popup menu.
- Click

- in the view tab to close the Active Symbols view.
- Left mouse click the view tab and hold down the mouse button to move the Fundamental Snapshot view. Release the mouse button to place it.
View Toolbar
The View Toolbar contains controls and settings specific to the Fundamental Snapshot view. Mouse hover over a button to see its tooltip.
Table to Spreadsheet button
- Click

- to export the Fundamental Snapshot table to a spreadsheet (sorting applied prior to exporting will be preserved in the spreadsheet).
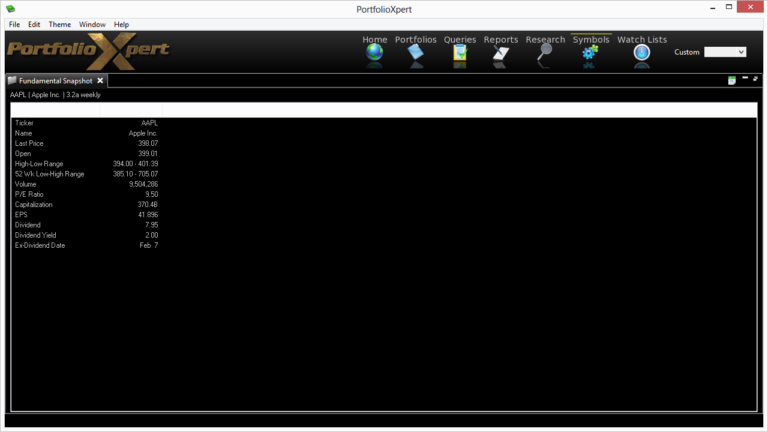
Information Displayed
- Ticker – security ticker symbol
- Name – security name
- Last Price – last closing price
- Open – current days opening price
- High-Low Range – range of prices over the entire security history
- 52 Wk Low-High Range – range of prices over the past year or 52 weeks
- Volume – cumulative security trading volume for current day (quote delayed)
- P/E Ratio – Price to Earnings Ratio (based on most recent price and last reported earnings)
- Capitalization – current market cap (based on shares outstanding and last price)
- EPS – Earnings per Share reported for the current year
- Dividend – most recent declared dividend (Quarterly or Annually)
- Dividend Yield – most recent annualized dividend compared to last price
- Ex-Dividend Date – last date the security trades with the most recent dividend declared
* If the security does not have any data to report for any of these categories, “N/A” (Not Applicable) will appear.