Market sentiment
Happy Thanksgiving, everyone!
There were only be commentary for Monday, Tuesday, and Wednesday this week commentary will resume on Monday, December 2.
As we come into the final week of the month, all indices have performed quite well, setting all-time new highs. The momentum that is being generated by this move suggests a sustainable rally for at least two more quarters is likely.
The last time that earning profits decreased for four quarters in a row was at the beginning of the third quarter of 2015. Interestingly, the earnings forecasts continue to come down as the market’s move to all-time new highs. In August 2015 was the beginning of this current rally that has been ongoing with only a small correction since then.
As I have been discussing for the last couple of months, I expect that the weakness in the PMI’s as well as manufacturing will begin the bottom, and most improvements will be seen in Q1 and Q2 of 2020. Also, there is a seasonal tendency for the market to be strong for the next several weeks suggesting that the upward targets are likely to be met.
Of course, we still have the trade negotiations between the U.S. and China as market participants are getting mixed signals on the potential for a “phase 1” deal. Also, there are new tariffs that could be enacted on December 15, as well as an increase from 25% to 30% on existing tariffs.
While the financial news media will continue to tell you that this is negative, the opposite has been true since the beginning of the tariffs. The U.S. continues to collect billions of dollars in tariffs. It is clear there have not been any inflationary pressures from them, as reflected in the CPI and the PPI numbers.
Meanwhile, the Chinese market is down nearly 20% while our markets are up over 20%. Therefore, it is clear to see who’s winning this battle. Most likely, we will see a “phase 1” deal sometime in Q1, and this will set the tone for more robust returns in the markets.
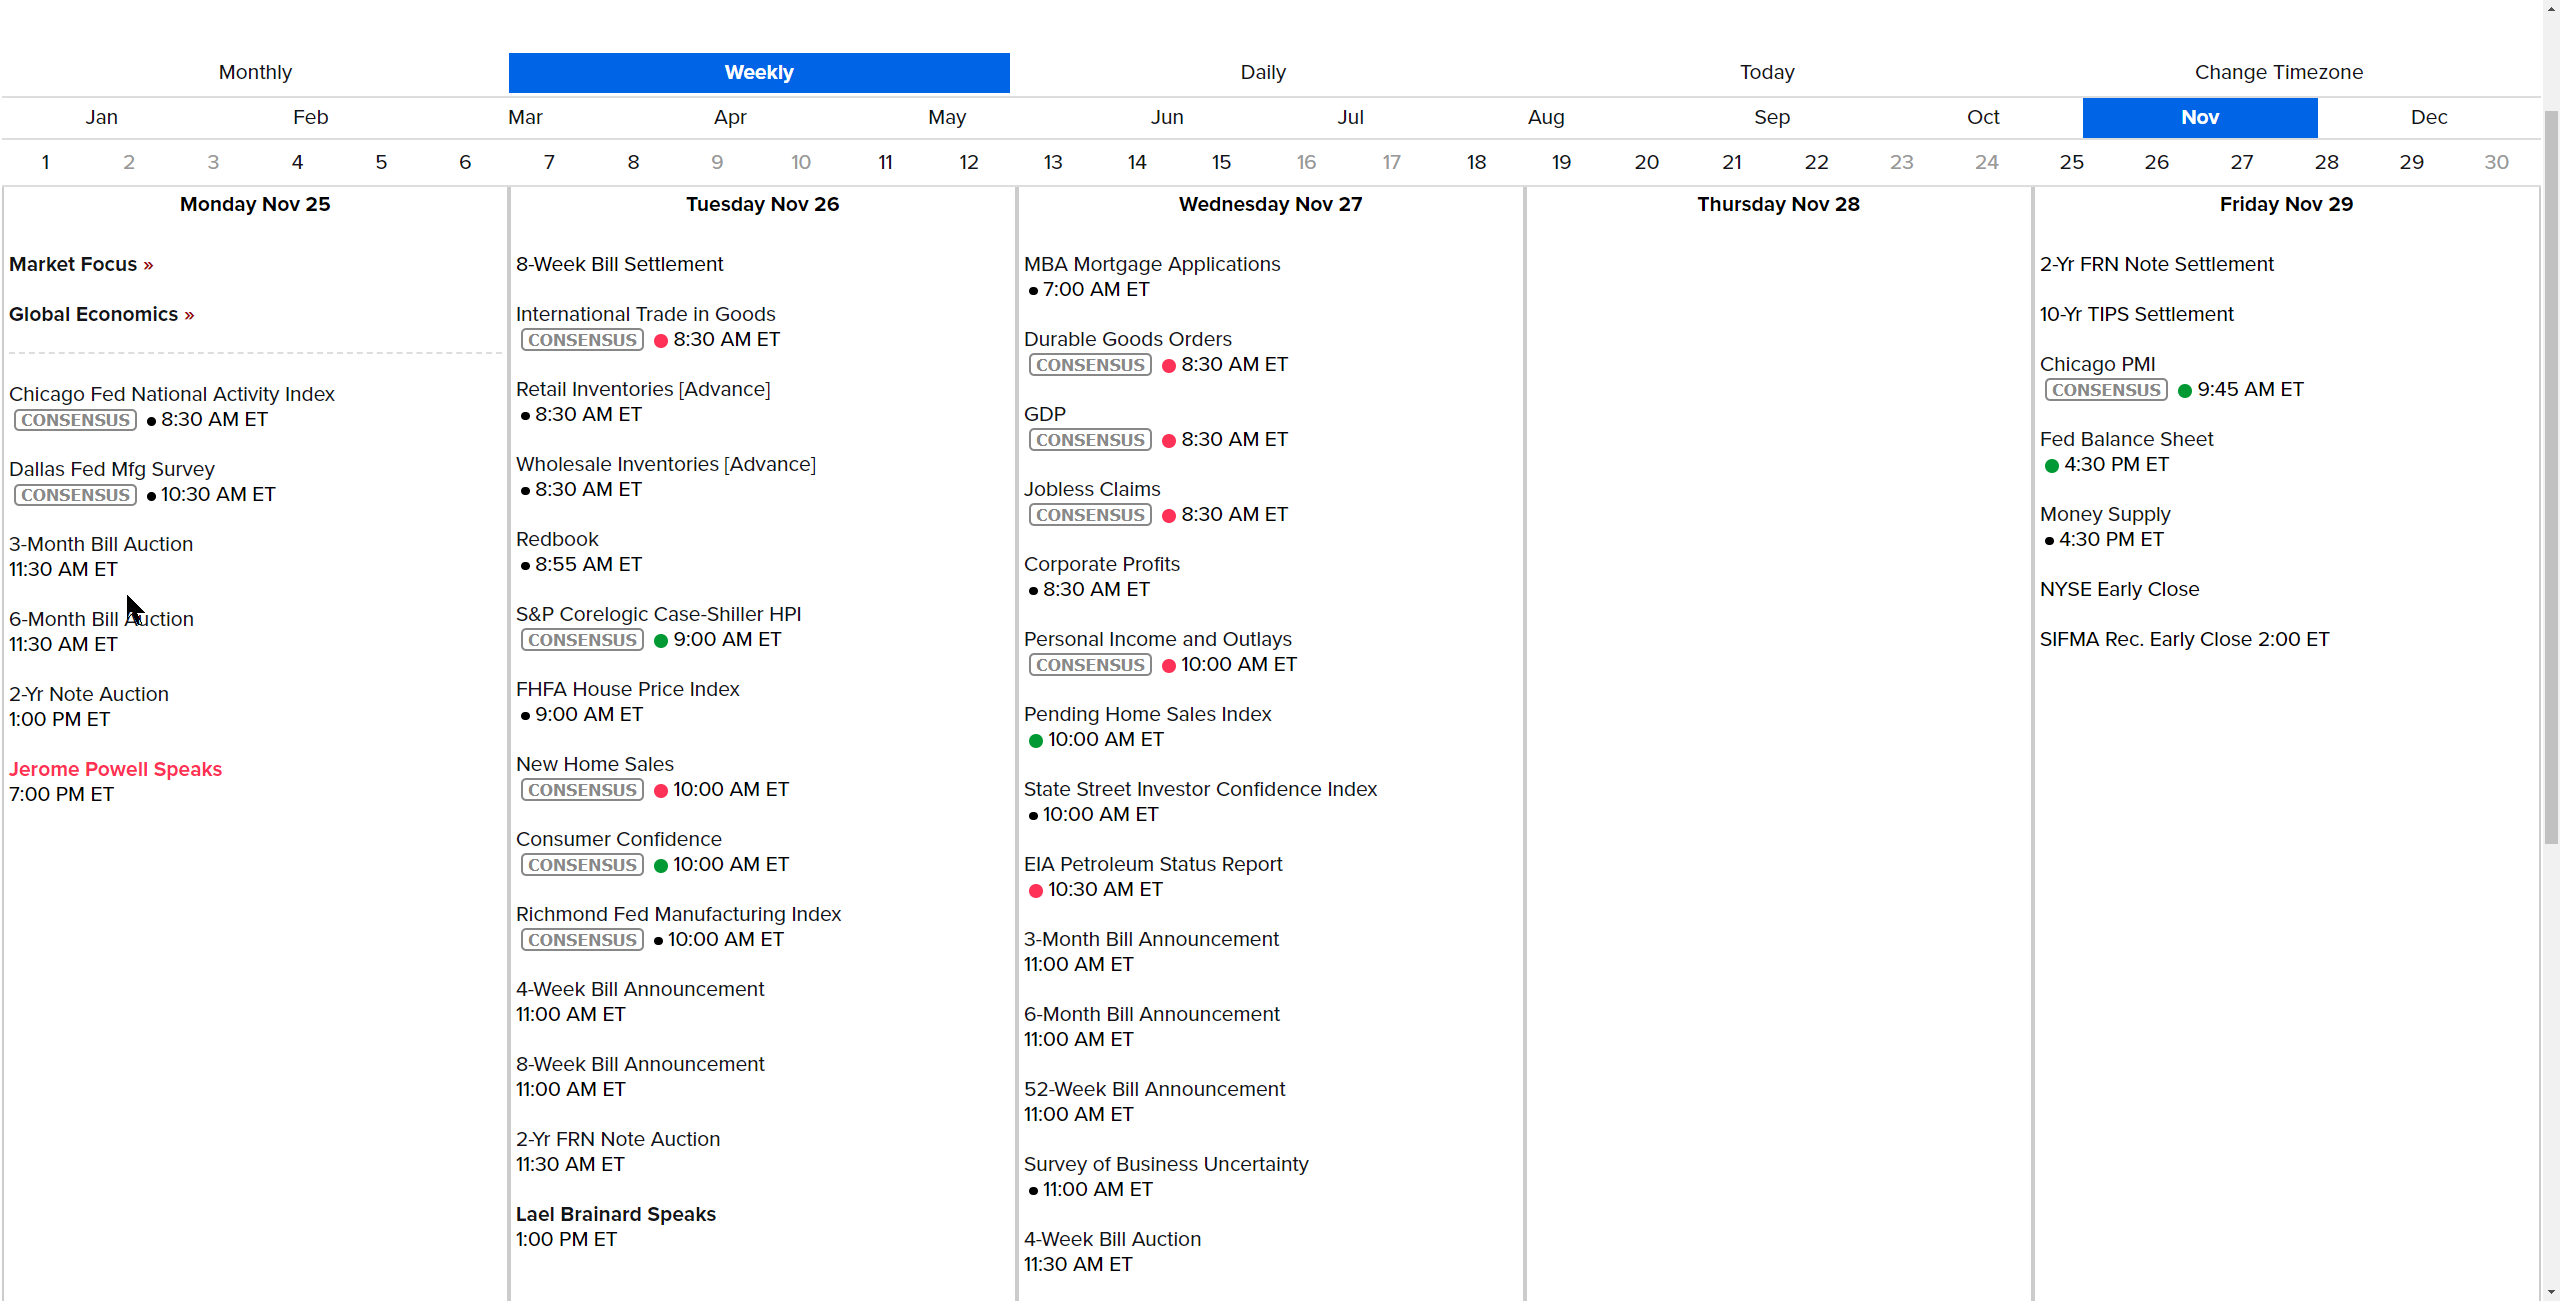
Economic Calendar
Looking back on last week
the S&P 500 and the NASDAQ closed slightly lower for the week as they declined 0.3%, while the Dow Jones and the Russell 2000 closed down 0.5%.
The week started with the large-cap indices rendering record highs, but stocks struggled as the rest of the week unfolded. A fake report by Reuters caused some volatility, but markets stabilized over the next couple of sessions.
The final earnings releases last week showed Home Depot and Kohls delivering some disappointment while target, Lowe’s, and Nordstrom’s were big winners. In spite of the mixed results, the retail index finished down 2.3% for the week.
The U.S. Treasury market experienced some curve-flattening activity this week. The 2-yr yield increased two basis points to 1.63%, while the 10-yr yield declined six basis points to 1.77%. The U.S. Dollar Index increased by 0.3% to 98.26. WTI crude increased 0.2%, or $0.13, to $57.88.
INDEX
STARTED WEEK
ENDED WEEK
CHANGE
% CHANGE
YTD %
DJIA
28004.89
27875.62
-129.27
-0.5
19.5
Nasdaq
8540.83
8519.88
-20.95
-0.2
28.4
S&P 500
3120.46
3110.29
-10.17
-0.3
24.1
Russell 2000
1596.45
1588.94
-7.51
-0.5
17.8
Gold
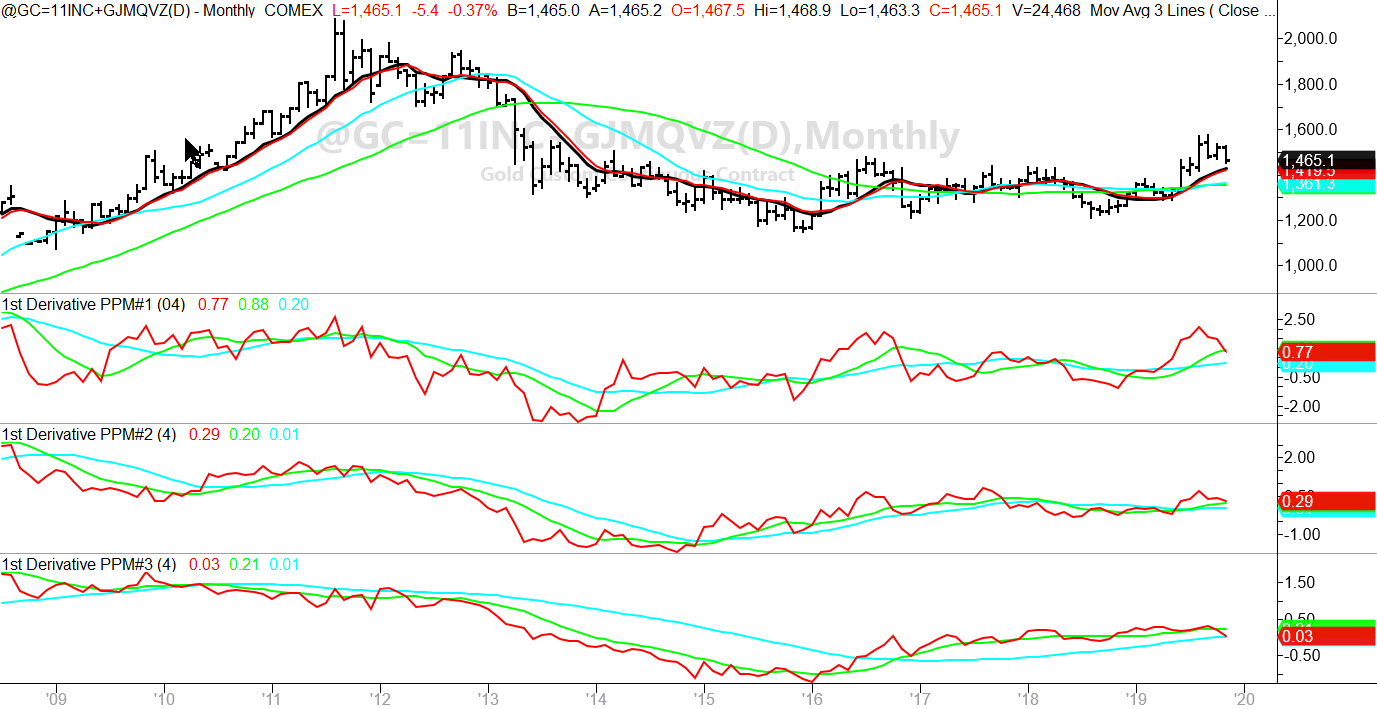
The gold market continues to lose momentum as the pattern suggests a retest of the 1453 level is likely. Support continues to be between 1448-1442 levels.
Intermediate charts confirmed the weakness suggesting there is a possibility of declining toward the 1422-1418 level before a bottom will be reached.
It will take a close above 1505 to negate the projected downward pressure.
Equity Market Technical Outlook
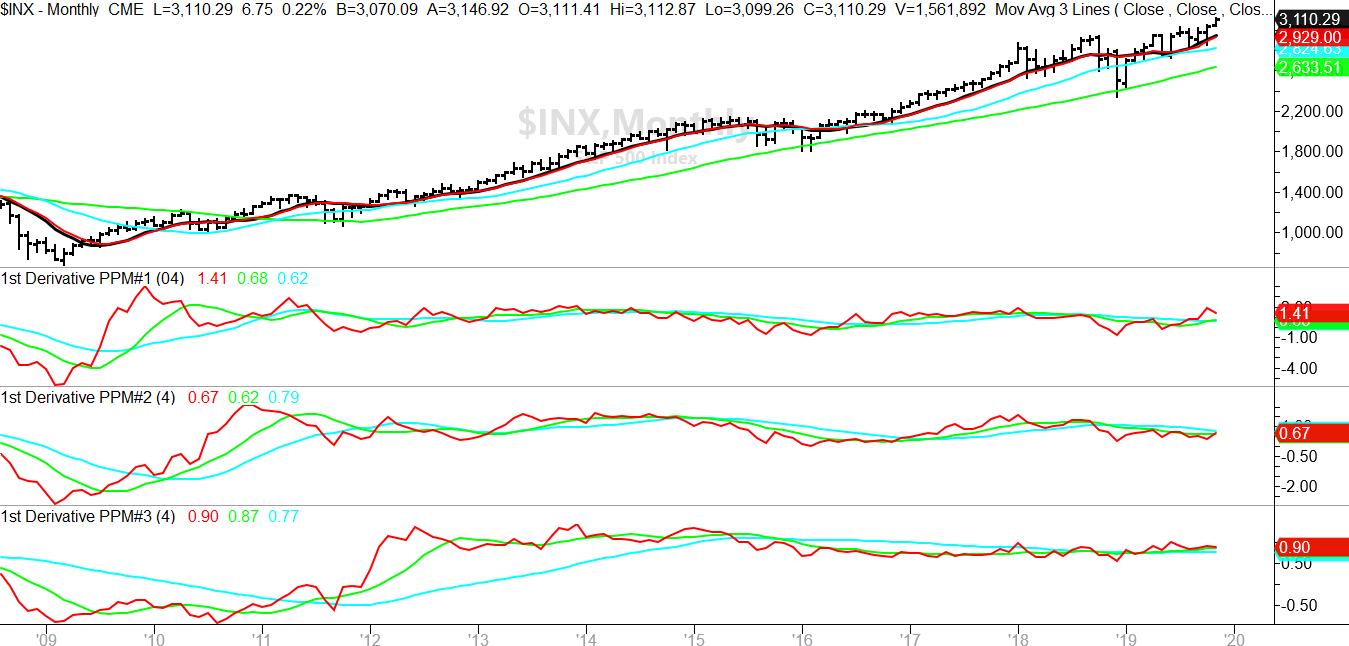
S&P 500 opened higher but then traded for most of the session in a sideways pattern before finishing just above the key resistance at 3110 with the close of 3110.29.
The configurations suggest that a rally toward the 3139-3147 levels is likely this week. The key support level is 3091.50. A penetration of this level would indicate a minor pattern failure and a retest of the 3080/3072 support levels. There is currently only a 30% probability for this to occur.
WaveTech Outlook
In spite of the tremendous volatility, the long-term patterns remain intact as long as the S & P 500 remains above 2742.
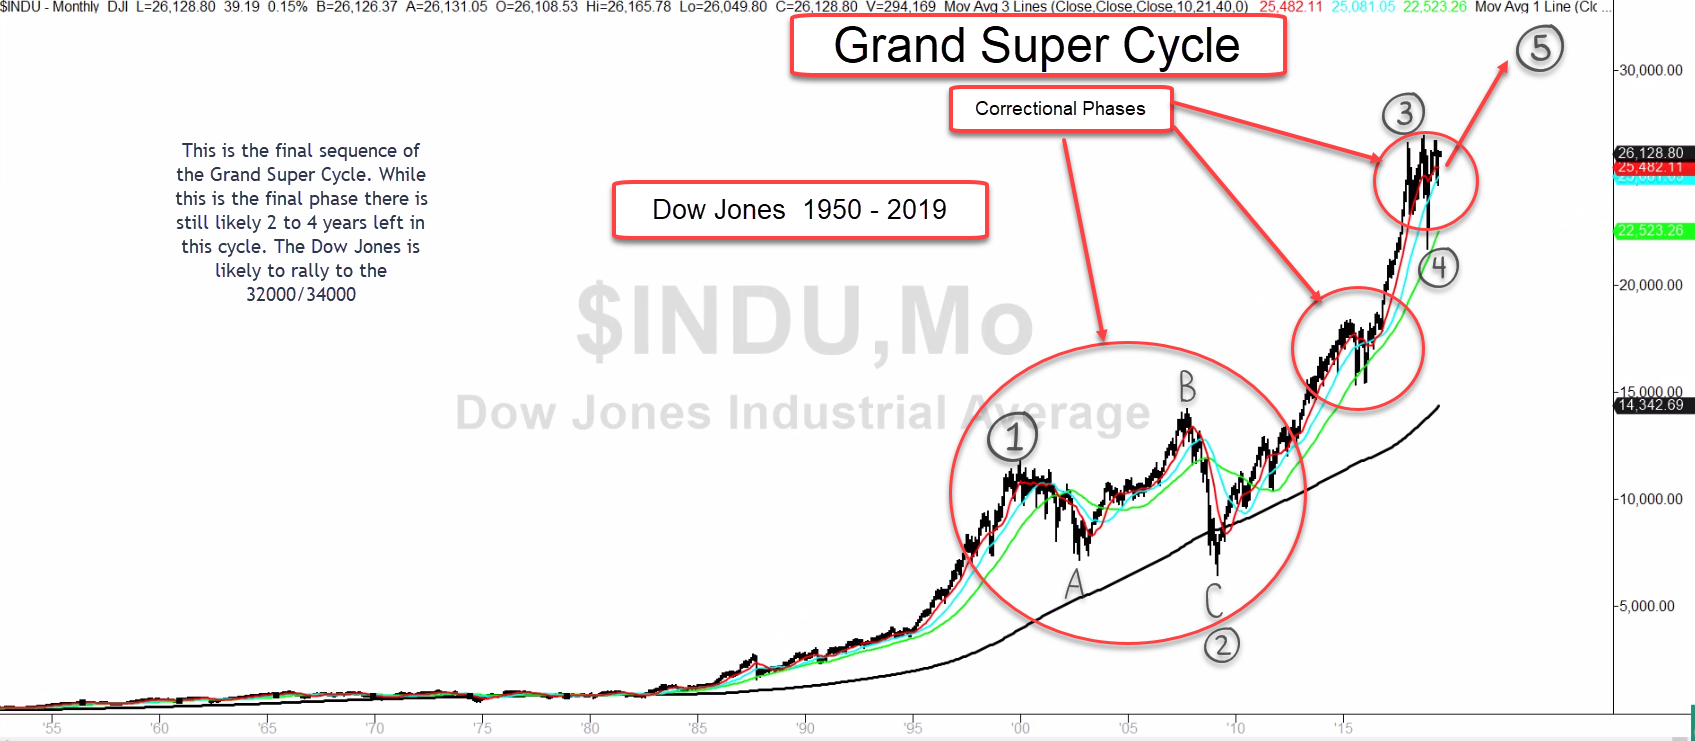
The chart below is a monthly graph encompassing the Dow Jones from 1950 to 2019.
As I have discussed before, it appears that there will be one more leg up with the S & P 500 moving toward the minimum of 3477 with the extreme projections of 3909/4176.
These are long-term projections, and there are at least two years before they will likely be reached.
Daily Projections
Weekly Projections
Monthly Projections
Resistance
Resistance
Resistance
Extreme
3129.20
Extreme
3147.90
Extreme
3209.50
Resistance 3
3124.75
Resistance 3
3139.00
Resistance 3
3168.90
Resistance 2
3119.75
Resistance 2
3129.10
Resistance 2
3123.55
Resistance 1
3114.75
Resistance 1
3119.15
Resistance 1
3078.15
S & P Prev. Close
3110.29+6.75
S & P Prev. Close
3110.29
S & P Prev. Close
3037.56
Support 1
3105.80
Support 1
3101.40
Support 1
2996.98
Support 2
3100.85
Support 2
3091.50
Support 2
2951.60
Support 3
3095.85
Support 3
3081.60
Support 3
2906.20
Extreme
3091.40
Extreme
3072.70
Extreme
2865.65
Support
Support
Support